Two chillers were chosen to perform an experiment using the CQM Automatic Tube Cleaning System at the Plaza Hotel Casino in Las Vegas, Nevada. The chillers are of the same model and age and are located side by side inside the hotel. Chiller 1 had the Automatic Tube Cleaning System installed on it while the other was left unaltered with the exception of the installation of sensors and data logging equipment. Both chillers had thermistors monitoring chilled water inlet/outlet temperatures and condenser water inlet/outlet temperatures. Flow meters were also installed to measure chilled water volumetric flow rate. A diagram of the CQM Automatic Tube Cleaning System can be seen in Figure 1 and an image of chiller 1 can be seen below in Figure 2.
The project aim was to capture data showing each chiller’s performance after Chiller 1 was thoroughly cleaned and the Automatic Tube Cleaning System (ATCS) was operating during the hot summer months in Las Vegas. If the ATCS performed as 2 expected, Chiller 1’s performance would be better than Chiller 2’s and remain so throughout the duration of the test. The savings in energy consumption by using the ATCS could then be estimated.


Installation of the CQM System
The Plaza Hotel has 4 chillers in their plant room. Two of their newest chillers, which were purchased and installed in 2011, were used for the CQM System tests. They are each 300 ton units made by Carrier. A table listing their properties can be seen below in Table 1.
The CQM System and data monitoring equipment were installed at the Plaza Hotel during the month of August 2012 (see Figure 2). The thermistors and flow meters were installed on August 8, 2012 for both systems. The split core current transformers were installed inside of the chiller’s electrical panels (See Figure 3).
Several issues were encountered during the installation. All eight thermistor signal wires were not long enough and each had extensions soldered to them. The data
logging system on Chiller 2 did not read its flow meter properly. Both systems did not communicate with their cellular modems nor did their cellular modems communicate with the local cellular provider. There was also what appeared to be a random ±0.5 degree Celsius drift in the temperature readings for all of the thermistors during their calibration in an ice bath.
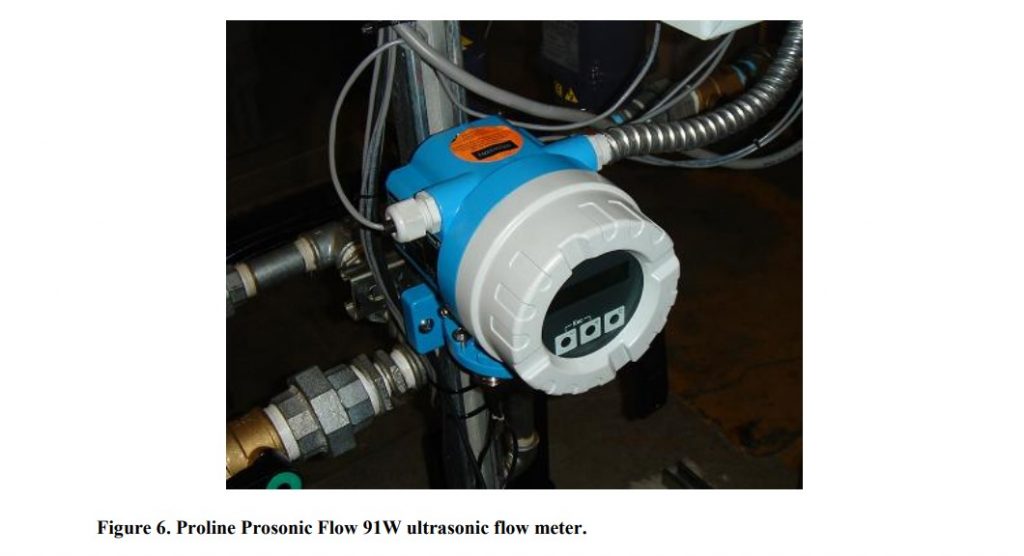
The problem with Chiller 2’s flow meter reading stemmed from it being set up while the chiller was running. The CQM monitoring equipment required that a no flow situation be used to zero the measurement. The Proline Prosonic Flow 91W ultrasonic flow meter outputs a 4 to 20 mA signal to the CQM monitoring equipment (see Figure 5 and Figure 6).



To account for this a DC power supply and a recently calibrated bench top multi-meter were used to calibrate the monitoring equipment on August 21, 2012. The CQM monitoring equipment used a 250Ω resistor for the flow meter measurement. This was confirmed by using the Data Precision 2480R bench top multi-meter to measure its resistance. The resistance was measured at 249.9Ω. The DC power supply was then connected directly to the monitoring equipment with the multi-meter to measure the voltage being applied (See Figure 7). Using Ohm’s Law, voltages were applied that would give 4 mA and 20 mA currents.

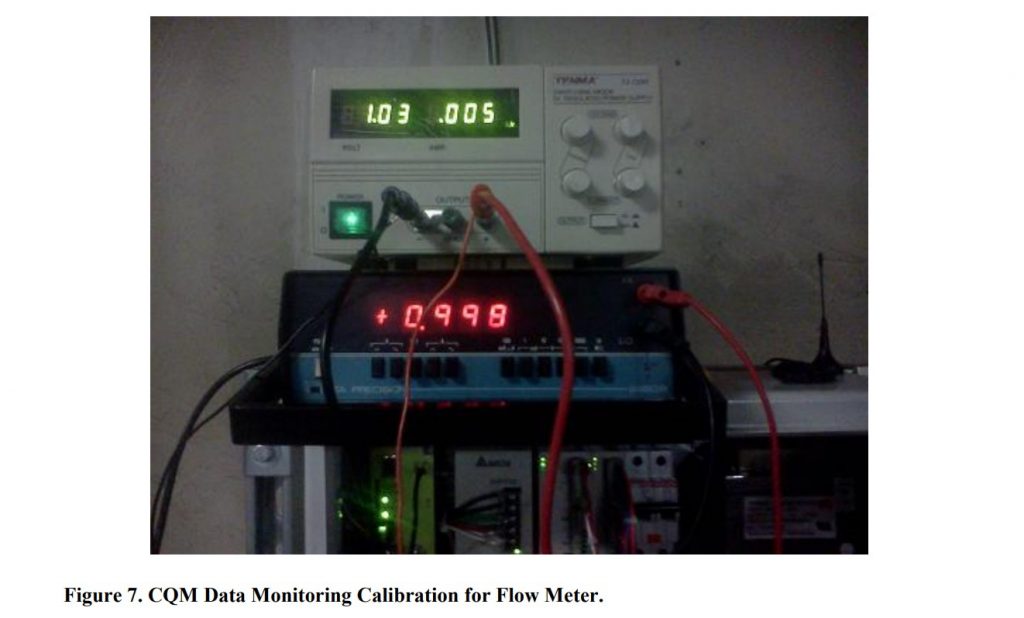
The 0.9996 voltage was applied to both chillers’ data monitoring equipment and the flow meter reading was zeroed on the display. Then the 4.998 voltage was applied to check the 20 mA reading. Both chillers’ monitoring equipment read just under 275 m3 /hr, which was the correct maximum reading. The monitoring equipment was then reconnected to the flow meter. After calibration the readings for both chillers consistently agreed with the reading on the flow meter’s display.
On August 23, 2012 the thermistors were calibrated by placing them in an ice bath and changing the offsets such that each one read 32 degrees Fahrenheit. The random drift was evident in each thermistor so the offsets were chosen such that each thermistor temperature reading was centered about the same temperature. A layer of Honeywell Heat Conductive Compound was applied to the surface of each thermistor probe and placed into their thermal wells. The cellular modem issues were all resolved by August 28, 2012 and data were taken from that point on.
Testing of the CQM System
Data collection began on August 28th, 2012 for both chillers at the Plaza Hotel.
The first few days of data showed that the condenser inlet temperature for chiller 2 was significantly lower than the condenser inlet temperature for chiller 1 (the chiller with auto ball cleaning system). This made chiller 2’s performance better than chiller 1 even though chiller 1 had just been cleaned. The inlet condenser temperatures were balanced for both chillers on August 30th, 2012 by allowing the inlet water to be mixed before entering each chiller. The performance relationship reversed with chiller 1’s performance in the lead. Daily averaged amount of electricity per each ton of refrigeration generated (kW/TR)
values for both chillers from August 28th through September 24th can be seen in Figure 8
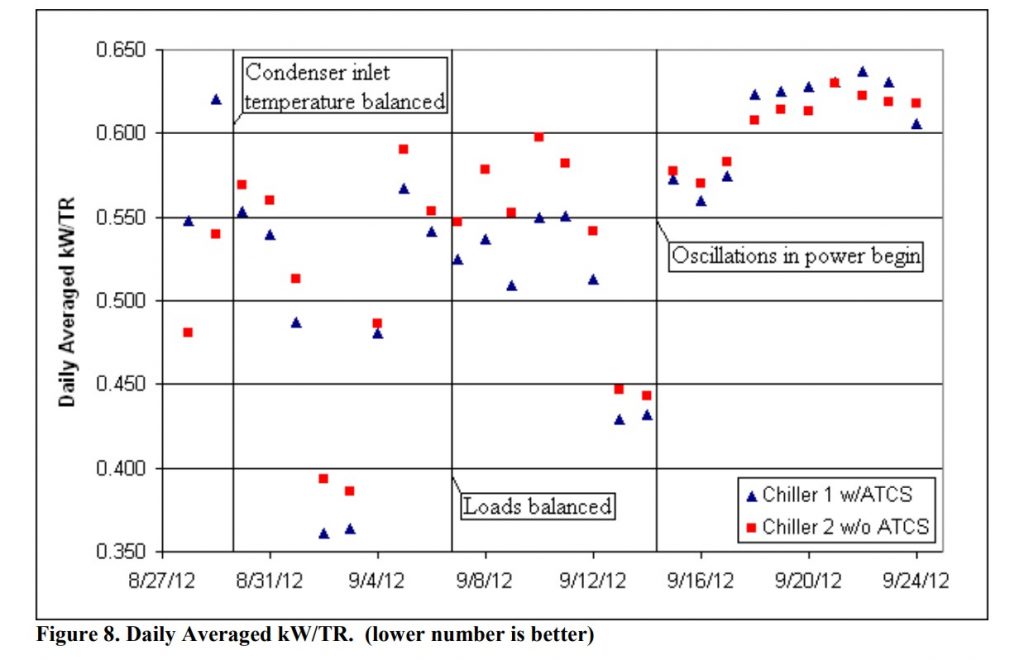
The flow rate and load were significantly higher for chiller 2 until September 7th where they were more closely balanced. Chiller 1 continued to outperform chiller 2 until September 14th which coincided with the start of large oscillations in power consumption for both chillers of roughly 20 kW peak to peak. This caused decreases in performance of both chiller 1 and 2 and made the comparison of the two almost indistinguishable. The reason for the large oscillations may have been the sudden drop in ambient temperature and building load because of the cloudy weather that occurred a few days previously.
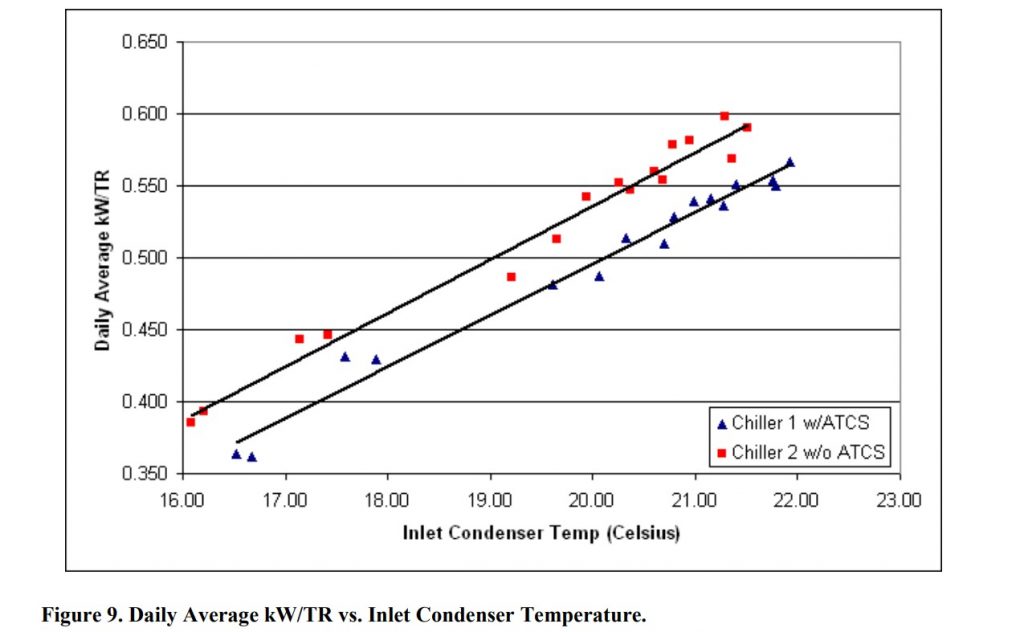
Two chillers were no longer necessary to keep up with the load of the Plaza Hotel which caused the chillers to run in hot gas bypass. It was decided instead of running both chillers simultaneously; one would be shut down for one week while the other was allowed to operate. Then the following week the operational chiller would be shut down for that week and the offline chiller would be used in its place for that week until enough data was acquired. One problem with testing in this fashion is that the comparison becomes more difficult because of differing operating condenser inlet temperatures. The chiller performance is very closely affected by the condenser inlet temperature as seen in Figure 9.
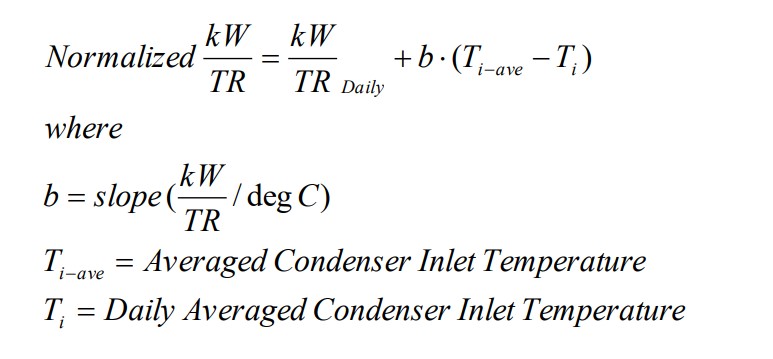
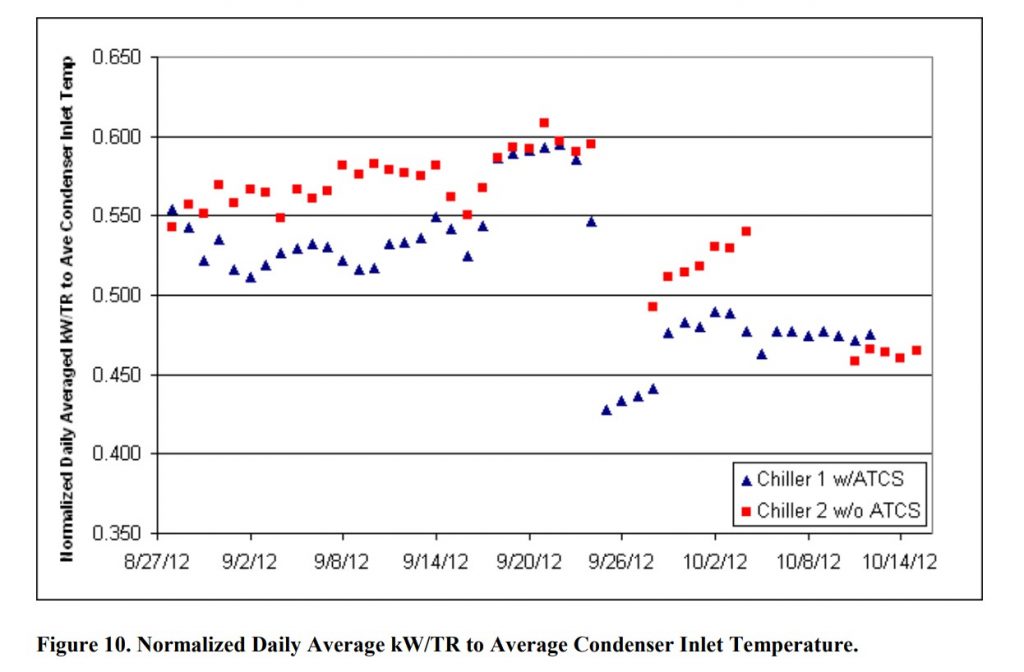
Figure 10 shows a normalized view of the kW/TR ratio for each chiller. There were still large variations, in some cases, in load, chilled outlet temperature, chilled water flow rate, and chilled water outlet temperature.
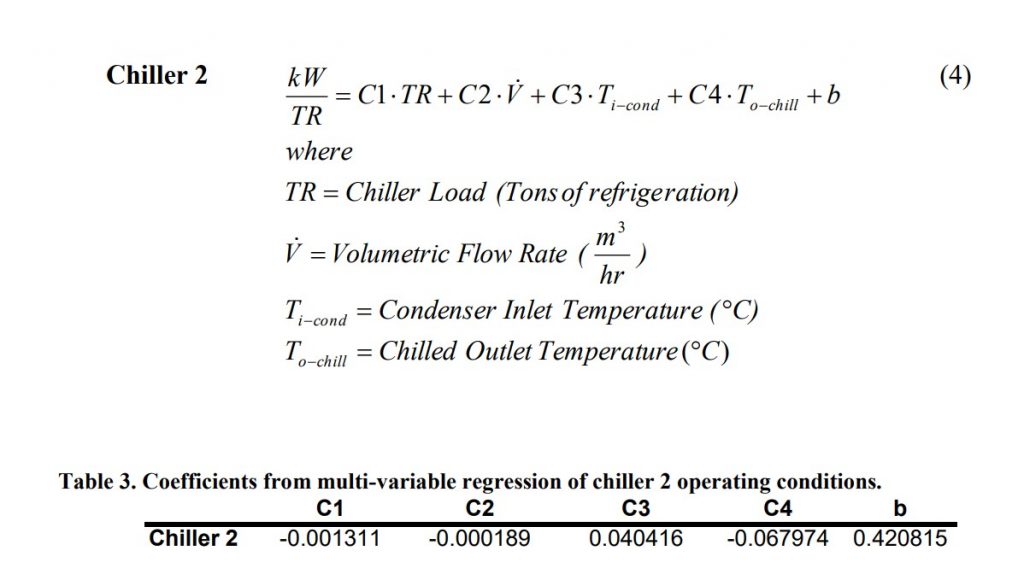
Although the plots are smoother and the chiller with the ATCS is nearly always outperforming the chiller without the ATCS, it is inconclusive as to whether the ATCS is maintaining its lead over the other. Further normalizations and a data filter are required to reach a conclusion. The filter of the data removed data from 9/14/2012 through 9/24/2012 because of the large oscillations in load for both chillers which led to low efficiency. The remaining data were compiled into sets separated by inlet condenser temperature and flow rate. Each set was averaged and a multi-variable regression was performed for each chiller. Chiller 1’s regression found coefficients for chiller load, inlet condenser temperature, and flow rate. Chiller 2’s regression found coefficients for chiller load, inlet condenser temperature, and outlet chilled water temperature. Chiller 2’s chilled water outlet temperature was not nearly as constant as Chiller 1’s so it had an additional
variable. A multi-variable regression is similar to a linear regression except that it takes all variables into account simultaneously which provide coefficients that give the smallest error.
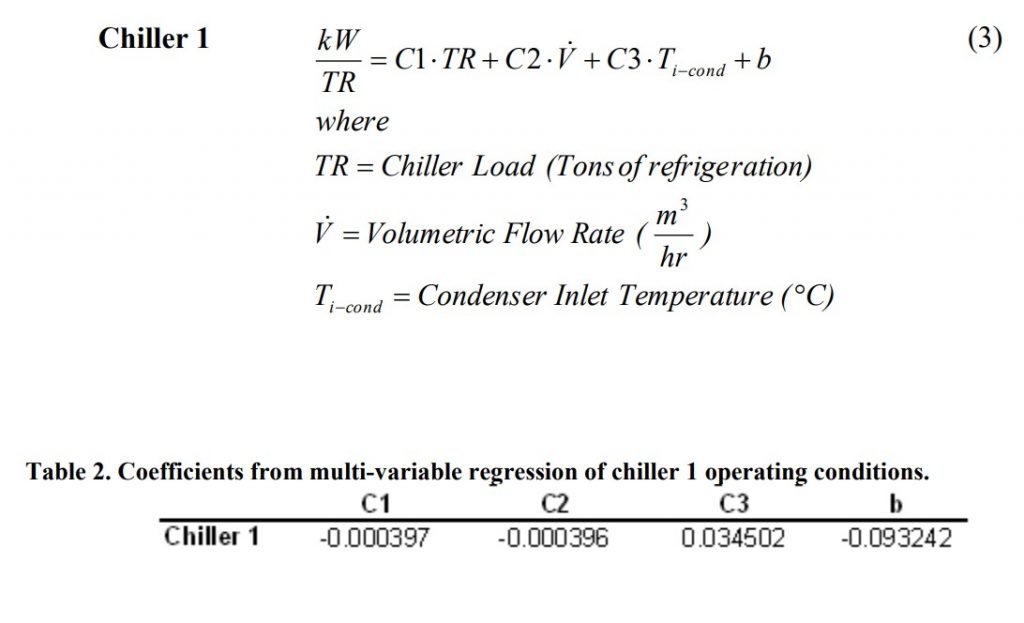
The regression for chiller 1 had an average accuracy of predicting the actual daily kW/TR to within 2.7% while the regression for chiller 2 had an average accuracy of 2.6%. Data for both chillers were then normalized for average inlet condenser temperature, average tons of refrigeration, average flow rate, and average chilled water outlet temperature and can be seen in Figure 11. The normalization was done in the same manner as the previous normalization except that in this case four variables were used instead of one. A second order polynomial fit is applied to both sets of data for comparison. Also shown in the figure is the uncertainty for each data point as well as the average of the entire data set kW/TR for each chiller shown as a solid line with its corresponding uncertainties shown as thinner dashed lines. After the normalizations are applied it is clearer that the chiller with the ATCS is consistently outperforming the chiller without the ATCS. Most of the data also falls within the average uncertainty for each chiller.
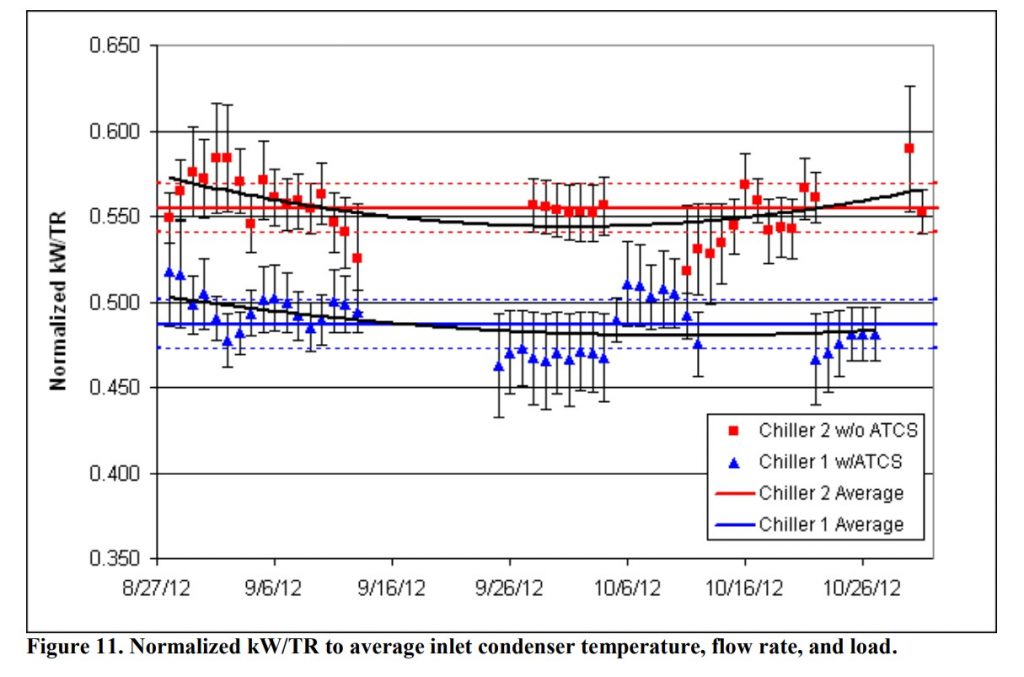
The measured results were taken at the time of the year when the loads were reducing. The performance of the system could be better seen with more data with the chillers running simultaneously under larger loads. We recommend revisiting the data after a longer running time.
Energy Savings
Since both chillers were operating under different conditions, two cases were estimated. The first case calculated the energy consumption of two chillers where both had the ATCS installed. So chiller 1’s performance data was directly used while chiller 2’s operating data was used to calculate how it would operate using chiller 1’s multivariable regression. The second case did the reverse, where both chillers did not have the ATCS system installed. So chiller 2’s performance data were directly used while chiller 1’s operating data were used to calculate how it would operate using chiller 2’s multivariable regression. The entire period from August 28th, 2012 to October 27th, 2012 was used to estimate the savings. The result was a saving in energy of 11.8% over the 61 days from using the ATCS and can be seen in Table 4.

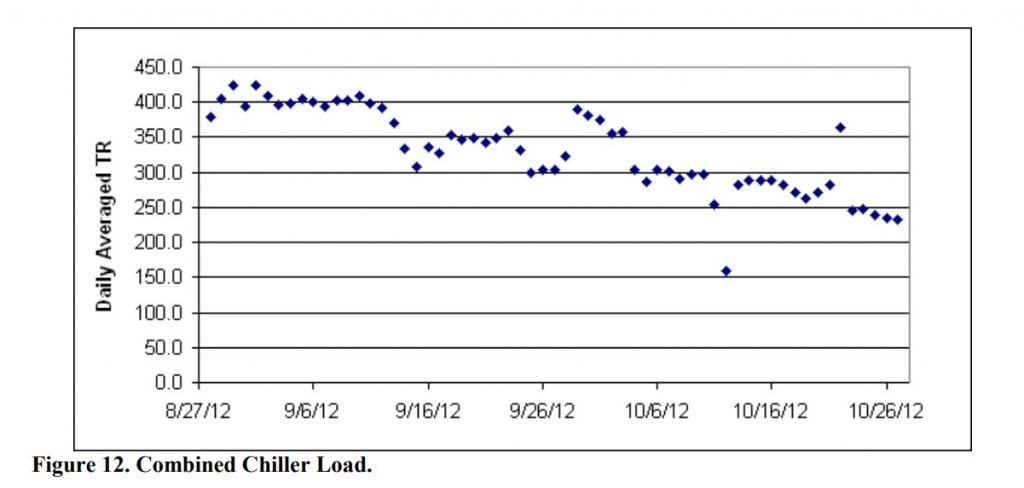
The savings should be larger (over 15%) during the hotter summer months where the chiller loads are high. Since the study started at the end of August, the combined chiller load generally fell as a function of time and can be seen in Figure 12.
